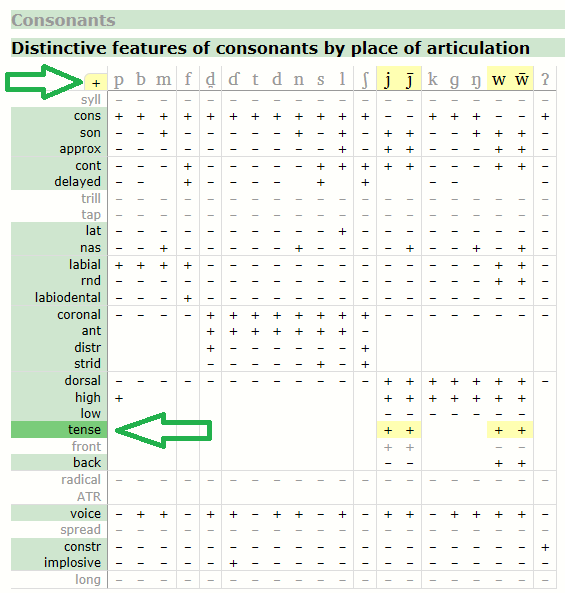
See: HTML chart.
The three examples shown below are in the Consonant Chart view. Vowel Chart view is similar.
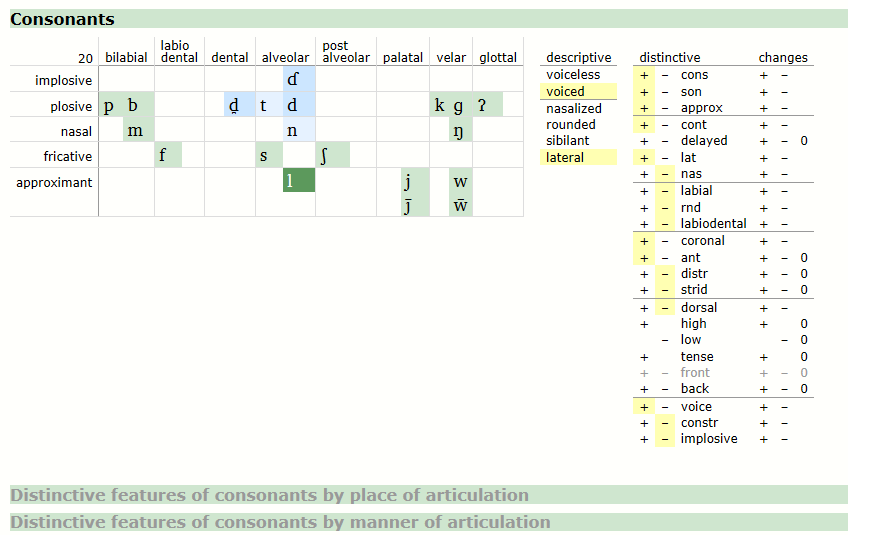
In this example, all the colored bands are shown collapsed. In Example 2, Consonants was clicked to expand it.
In this example, notice that the cursor was held over the "l". You can tell by the darker color of the cell. The descriptive and distinctive features are highlighted with yellow (at the right side).
In this example, notice that the cursor was
held over "tense" in the left column. Because control at
the top left corner is set to +, each
+ in the table and the phone in the
column heading is highlighted. You can click the control to toggle
it between + (plus), -
(minus) and 0 (unspecified). Then
you can more quickly examine the chart.